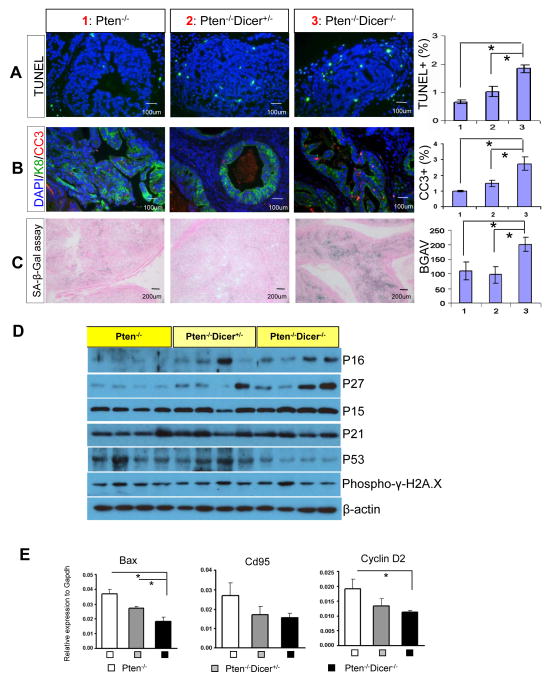
Fig. 4. Suppressing Dicer activity enhances cellular apoptosis and senescence in the Pten null mouse model for prostate cancer.
(A) TUNEL assay and (B) IHC analysis of cleaved caspase 3 with luminal cell marker K8 in prostate tissues from Pten−/−, Pten−/−Dicer−/+, and Pten−/−Dicer−/− mice at 15 weeks. Bar graphs show quantifications. (C) β-galactosidase staining measuring cellular senescence in Pten−/−, Pten−/−Dicer−/+, and Pten−/−Dicer−/− mice. BGAV: β-galactosidase activity value. Bar graph quantifies the level of senescence. (D) Western blot analyses of expression of P16, P27, P15, P21, P53, and phosphor-γH2A.X in 15 week-old Pten−/−, Pten−/−Dicer−/+, and Pten−/−Dicer−/− mice. Individual lanes represent specimens from different mice. (E) qRT-PCR analysis of expression of three P53 target genes Bax, CD95 and Cyclin D2 in prostate tissues from Pten−/−, Pten−/−Dicer−/+, and Pten−/−Dicer−/− mice at 15 weeks. In all figures, data represent means ± SD. *: p < 0.05.

