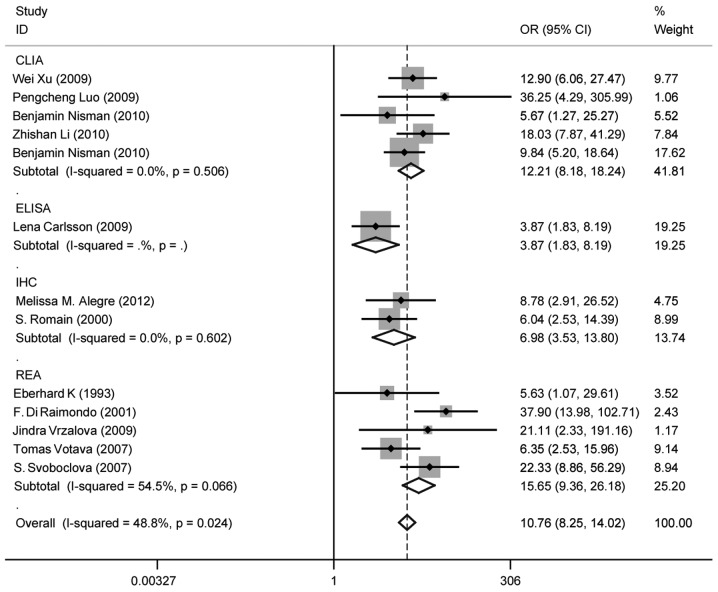
Figure 7.
Odds ratio (OR) funnel plot of thymidine kinase 1 subgroups according to different methods following deletion of the two studies mentioned above. [Xu et al (33) and McKenna et al (38)]. One of these used the chemiluminescence immunoassay (CLIA) and the other one the enzyme-linked immunosorbent assay (ELISA) method. P-value >0.05. No I2 or P-value could be calculated for ELISA as there was only one study. CI, confidence interval.

