
Figure 1.
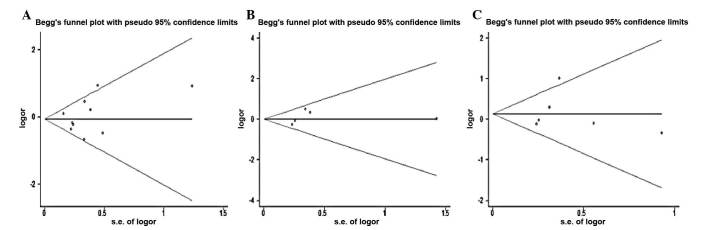
Begg’s funnel plot indicated that no publication bias was observed (A) for GG vs. AA comparison in FAS-670 A/G polymorphism; (B) for AA vs. GG comparison in FAS-1377G/A polymorphism; (C) for CC vs. TT comparison in FASL -844T/C polymorphism. Each point represents a separate study for the indicated association. Log[OR] natural logarithm of odds ratio. Horizontal line indicates the effect size.