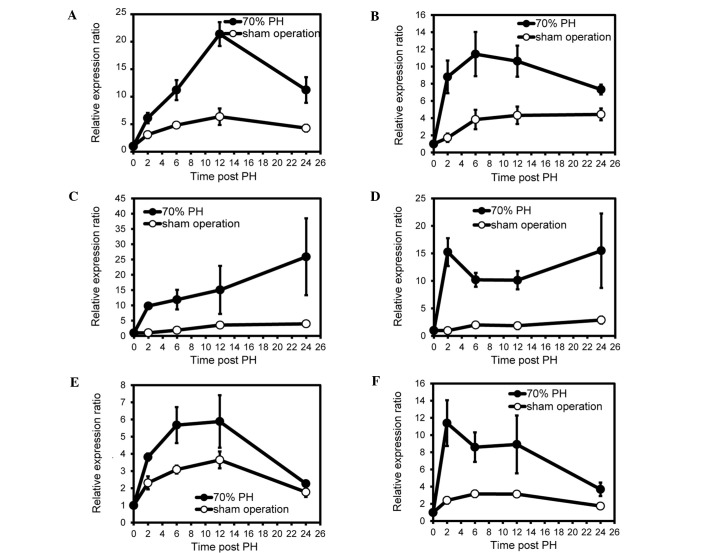
Figure 3.
Relative expression ratio of Apoa4, Hp and Fgb sense and antisense transcripts in the early phase of live regeneration. Total RNAs were isolated from regenerating and sham-operated livers (n=3 at each time point). Strand-specific cDNA derived from sense or antisense transcripts was synthesized using the reverse or forward primers described in Table III. qPCRs were performed using these primer pairs, Power SYBR-Green PCR Master Mix and StepOnePlus Real-Time PCR system. Means ± standard error of the mean (SEM) were obtained using the standard-curve method and calculated taking the values of strand-specific RT-qPCR at 0 h post PH (normal livers) as 1.0. (A) Apoa4 sense transcripts. (B) Apoa4 antisense transcripts. (C) Hp sense transcripts. (D) Hp antisense transcripts. (E) Fgb sense transcripts. (F) Fgb antisense transcripts.

