Table 2.
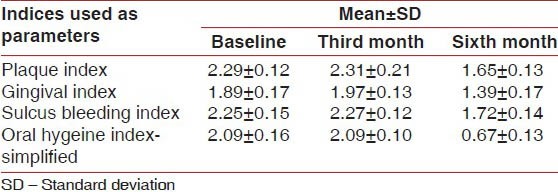
Distribution of mean±SD values of all parameters at the baseline, third month, and sixth month in the control group (n=120)

Distribution of mean±SD values of all parameters at the baseline, third month, and sixth month in the control group (n=120)
