Table 4.
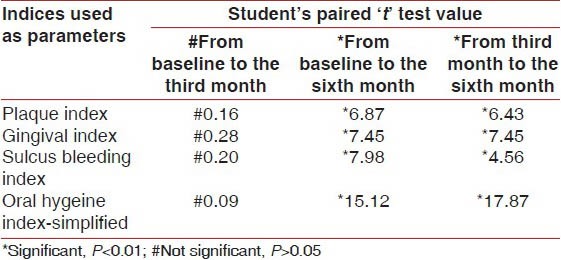
Values of student's paired ‘t’ test under comparison of differences of all parameters from baseline to the third month, from baseline to the sixth month, and from the third month to the sixth month in the placebo control group (n=120)

Values of student's paired ‘t’ test under comparison of differences of all parameters from baseline to the third month, from baseline to the sixth month, and from the third month to the sixth month in the placebo control group (n=120)
