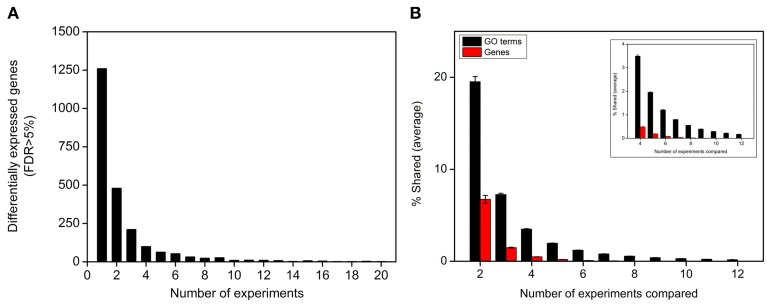
Figure 2.
Biological functions are more robust than gene identities in the nitrate response. (A) Histogram of 2286 significantly nitrate responsive genes (rankproduct, FDR < 5%) vs. the number of experiments in which were regulated. (B) Histogram of the average percentage of elements (over-represented GO terms or genes) shared between different number of experiments. Inset shows the same graph but starting from 4 experiments.

