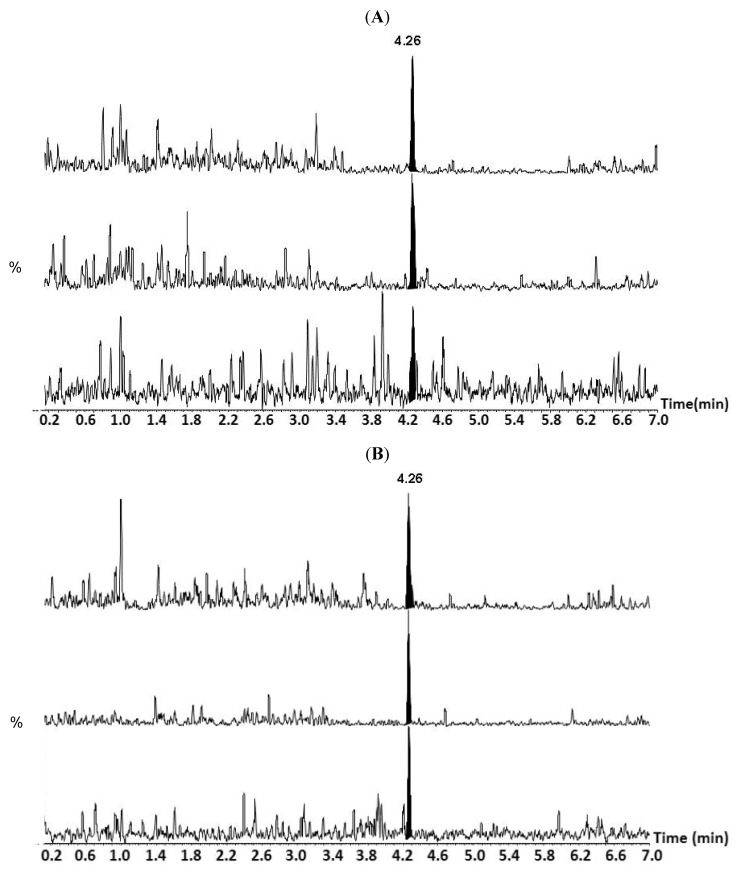
Figure 2.
LC-MS/MS chromatograms showing three multiple reaction monitoring (MRM) traces m/z 320 > 302, 320 > 162 and 320 > 60 from top to bottom (A) Arachnoides zelandiae with area ratios for each channel of 1.00:0.66:0.16 and (B) Authentic TTX at 0.5 ng/mL with area ratios for each channel of 1.00:0.63:0.21. The x-axis is time (min) and the y axis is LC-MS/MS response normalised to the largest peak in each MRM channel.

