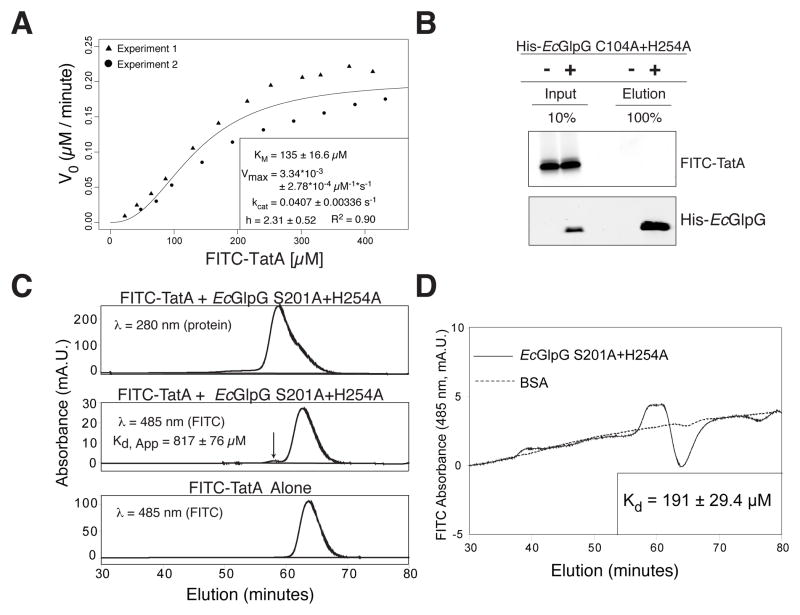
Figure 4. Intramembrane proteolysis kinetics and equilibrium binding analyzed in 3-dimensions.
(A) Michaelis-Menten plot of FITC-TatA cleavage by HA-EcGlpG in detergent micelles (inset: fit ± sd). Variation increased at >100 μM due to variable solubility of the transmembrane substrate. (B) Analysis of FITC-TatA coprecipitation with the inactive mutant His-EcGlpG C104A+H254A. Quantification revealed <0.1% of FITC-TatA eluting with His-EcGlpG, which under non-equilibrium conditions corresponds to an apparent Kd ≥ 1 mM. (C) HPLC gel filtration analysis of FITC-TatA mixed with HA-EcGlpG S201A+H254A reveals a small complex peak (arrow), which is absent in the elution profile of FITC-TatA alone. The single A280 (protein absorption) peak is an overlap of HA-EcGlpG (eluting first) and FITC-TatA (right shoulder). (D) HPLC equilibrium gel filtration analysis of FITC-TatA/EcGlpG (inactive S201A+H254A mutant) complex versus FITC-TatA/BSA control run on a column equilibrated with 9.5 μM FITC-TatA. The A485 (FITC absorption) peak corresponds to the GlpG-TatA complex, while the trough results from FITC-TatA depletion from the mobile phase due to GlpG binding (peak/trough absence with BSA indicates no binding).

