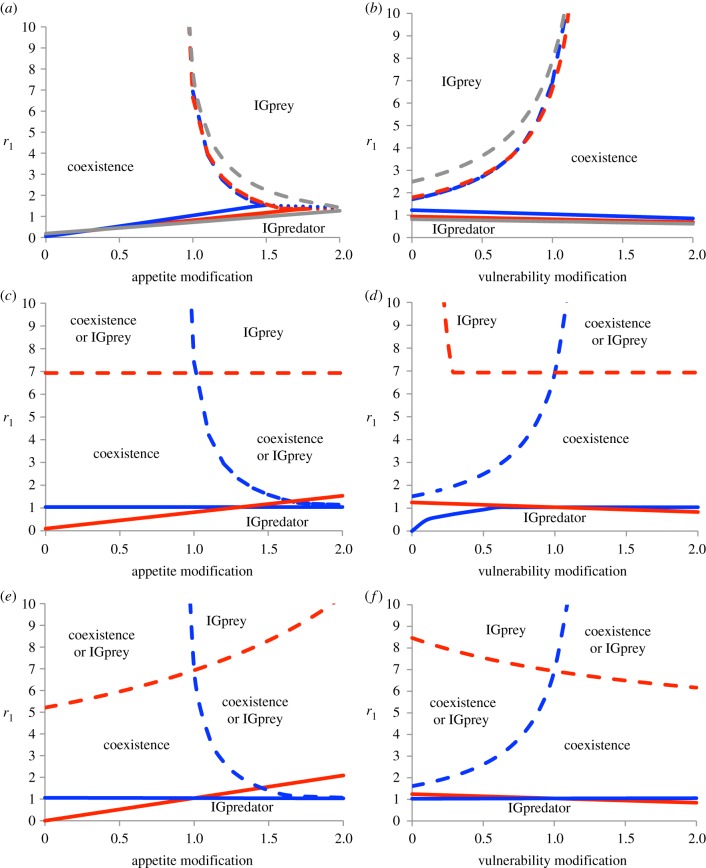
Figure 2.
Impact of trait- and density-mediated indirect effects of parasitism on IGP, on boundaries between stable states in terms of r1 (reproductive rate of IGprey) given parasite effect on one trait (horizontal axis), with the second trait fixed. Lines show state boundaries for hosts/virulence (as coloured): dashed lines, coexistence-IGprey boundaries; solid, coexistence-IGpredator; dotted, IGprey–IGpredator. (a,b) Parasite infects both species and modifies traits symmetrically (red, Ω1 = 0.1, Ω2 = 0.3; blue, Ω1 = Ω2 = 0; grey, Ω1 = Ω2 = 0.5); (c,d) parasite infects one species (blue, IGprey as host; red, IGpredator host); (e,f) parasite infects both species but modifies traits of only one (blue, IGprey affected; red, IGpredator affected; virulence in c–f, Ω1 = Ω2 = 0). Parameter subscripts: 1, IGprey; 2, IGpredator.

