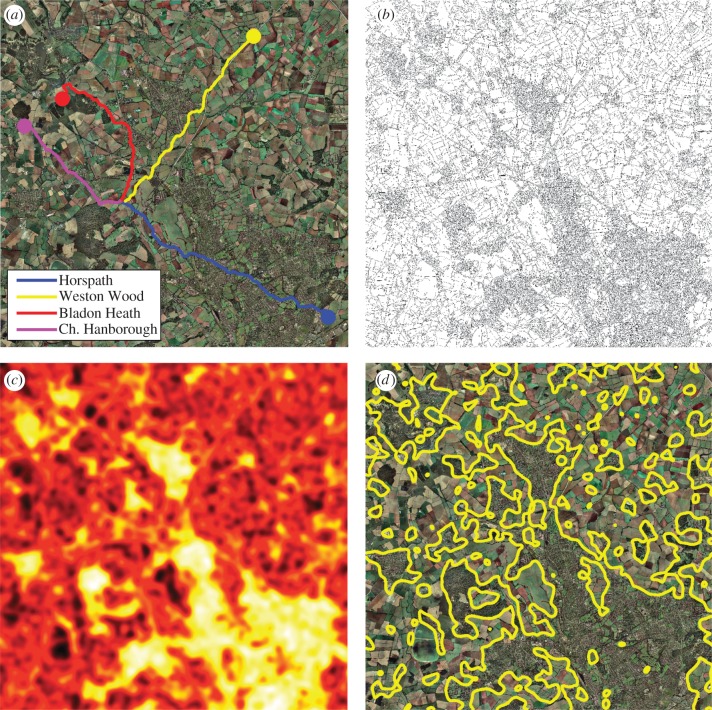
Figure 1.
Details of the visual landscape. We analysed the visual information provided by the landscape using an aerial image of the Oxford area (a), with a single flight path from each of the four release sites shown to indicate coverage. We filtered this image to detect ‘edges’, defined as sharp changes in image intensity (b). The local density of these edges was calculated by evaluating the number of edges in the local area to produce an edge-density map (c), which indicates the amount of information in a local region. After determining the optimal edge density by our regression analysis (figure 2), we overlaid a contour of this edge density on the original aerial image (d), showing that the optimal density is found on the boundary between urban or forested regions and open rural regions.

