Figure 1.

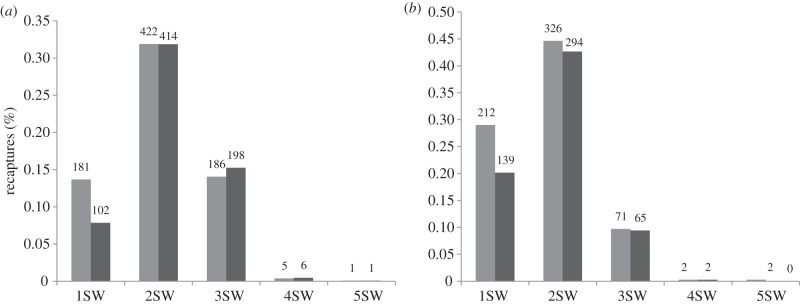
Bar plot of the per cent recapture of treated (light grey) and untreated (dark grey) salmon, divided into sea-winters (SW), for the (a) Vosso and (b) Dale experiments. The number of recaptures is indicated above the bars.

Bar plot of the per cent recapture of treated (light grey) and untreated (dark grey) salmon, divided into sea-winters (SW), for the (a) Vosso and (b) Dale experiments. The number of recaptures is indicated above the bars.