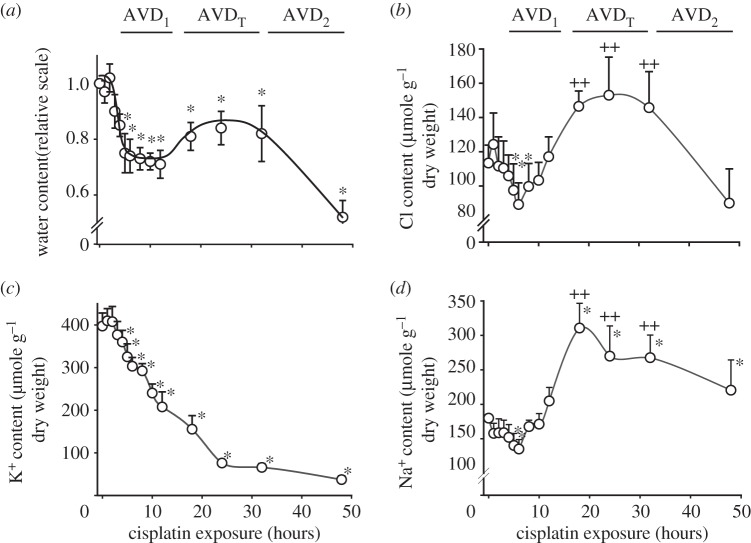
Figure 3.
Time-dependent changes in cellular water content and ion content in Wt EATC following exposure to 5 µM cisplatin. (a) The water content (millilitre per gram cell dry weight) was normalized to values obtained prior to cisplatin exposure. (b) Cl− content (micromole per gram cell dry weight) was obtained by Ag+ titration. (c,d) K+ and Na+ content was determined using emission flame photometry. The values are reported as means with the standard error of the mean. Asterisks (*) and plus symbols (++) indicate values that were significantly different from the initial control value. Adapted from [19].

