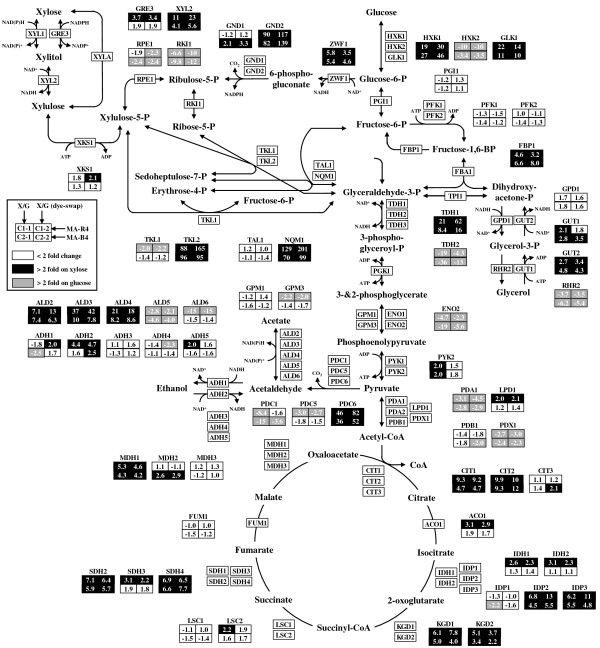
Figure 3.
Expression profiles of genes involved in central carbon metabolism (including glycolysis, PPP, and TCA cycle) of MA-R4 and MA-B4 during fermentation of glucose (G) and xylose (X). The fold change (log2) calculated as the ratio (xylose/glucose) for transcripts of cells grown on xylose (X1 or X2 stages) to cells grown on glucose (D1 or D2 stages) is presented inside of each box for the C1-1, C1-2, C2-1, and C2-2 comparisons; positive values indicate up-regulation and negative values down-regulation on xylose. C1-1 (MA-R4 Xylose/Glucose), C1-2 (MA-R4 Xylose/Glucose, dye-swap), C2-1 (MA-B4 Xylose/Glucose), and C2-2 (MA-B4 Xylose/Glucose, dye-swap) designate specific pairwise comparisons. Transcript levels that changed more than 2-fold with xylose or glucose are shown in black and gray boxes, respectively. Transcript levels that did not change significantly on the two carbon sources are shown in white boxes. The nomenclature follows that of the Saccharomyces genome database (http://www.yeastgenome.org/).

