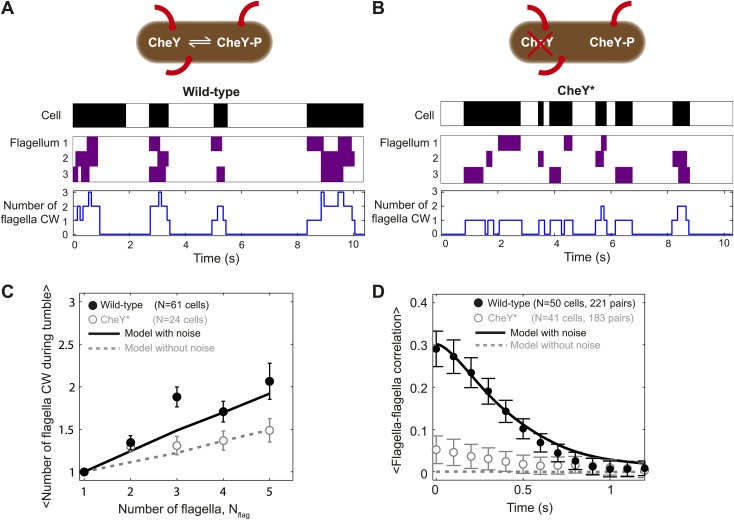
Figure 2. Tumbles in wild-type cells involve multiple CW flagella.
(A) A typical time trace from a wild-type cell with 3 flagella. Colors indicate runs/tumbles (white/black, top) and CCW/CW (white/purple, middle). The blue line (bottom) shows the corresponding number of CW flagella at each time point. (B) Same as (A) for a typical CheY* cell with 3 flagella. (C) Mean of the maximum number of CW flagella during a tumble vs number of flagella per cell. Consistently more flagella are CW during tumbles in the wild-type (black circles; N = 61 cells) compared to the CheY* strain (open gray circles; N = 24 cells). Simulations incorporating fluctuations in CheY-P (black line) and without fluctuations (gray dashed lines) reproduce the observed trends (simulations detailed in the text and Figure 4). (D) Cross-correlation between flagella pairs, averaged over all pairs and all cells. Wild-type (black circles) match simulations with fluctuations in CheY-P (black line). CheY* strain (open gray circles) matches simulations without fluctuations in CheY-P (gray dashed line), which exhibit almost no correlation. Error bars denote SEM. See ‘Materials and methods’ for more details.


