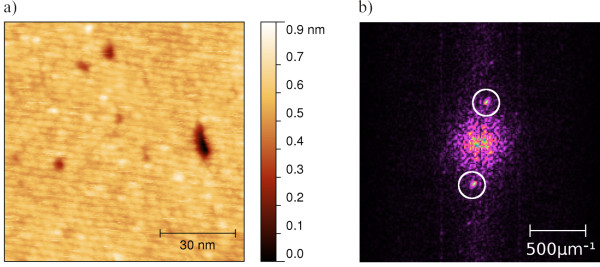
Figure 3.

Nc-AFM micrograph of [MnIII6CrIII](ClO4)3 on HOPG, 94 × 99 nm2 scan. The scan was done in area 2 of Figure 1 with a LCPD of -0.38 V. (a) Topography showing stripes which cover the whole area of -0.38 V. (b) FFT image revealing a period of the stripes of 2.9 ± 0.2 nm.
