Figure 1.

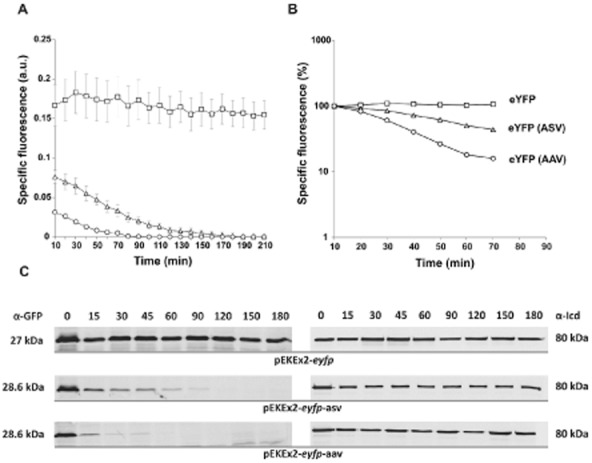
Stability of eYFP variants in C. glutamicum.(A) Fluorescence of recombinant C. glutamicum ATCC 13032 strains expressing eyfp variants: ATCC 13032/pEKEx2-eyfp (squares), ATCC 13032/pEKEx2-eyfp-asv (triangles), ATCC 13032/pEKEx2-eyfp-aav (circles). Prior induction, cells were inoculated to an OD600 of 1 in 750 μl of CGXII minimal medium containing 4% glucose and cultivated in 48-well microtiter plates in the BioLector system (m2p labs, Germany). Gene expression was induced by addition of 1 mM IPTG. To estimate the stability of the eYFP variants 250 μg ml−1 rifampicin (Rif) and 100 μg ml−1 tetracycline (Tet) were added 1.5 h after induction to stop the transcription and translation. In the BioLector system the growth (backscatter signal of 620 nm light) and eYFP fluorescence (excitation 510 nm/emission 532 nm) were monitored in 10 min intervals. The specific fluorescence was calculated as fluorescence signal per backscatter signal (given in arbitrary units, a.u.). Results represent average values with standard deviation of three independent experiments.(B) Logarithmic scale blotting of data shown in 1A. Specific fluorescence of each strain to the time of antibiotic addition was set to 100%.(C) Determination of half-lives via Western blot analysis of eYFP (27.0 kDa), eYFP-ASV (28.6 kDa) and eYFP-AAV (28.6 kDa). Cells were cultivated in 70 ml of BHI medium with 2% glucose to an OD600 of 3–4. Prior and after addition of Tet and Rif (addition of antibiotics after 1.5 h) 5 ml of cells were harvested by centrifugation and subsequently frozen in liquid nitrogen. For isolation of crude extract cells were ruptured with glass beads in TE buffer (10 mM Tris, 1 mM EDTA, pH 8) with complete protease inhibitor (Roche, Germany). Samples (25 μg) were loaded on two identical SDS gels and proteins were separated by SDS-PAGE and analysed via Western blot analysis using anti-GFP (cross-reacting to eYFP) and anti-Icd for referencing (80 kDa). The intensity of bands was analysed with the AIDA software version 4.15 (Raytest GmbH, Germany). The images are representative ones out of three independent biological replicates.
