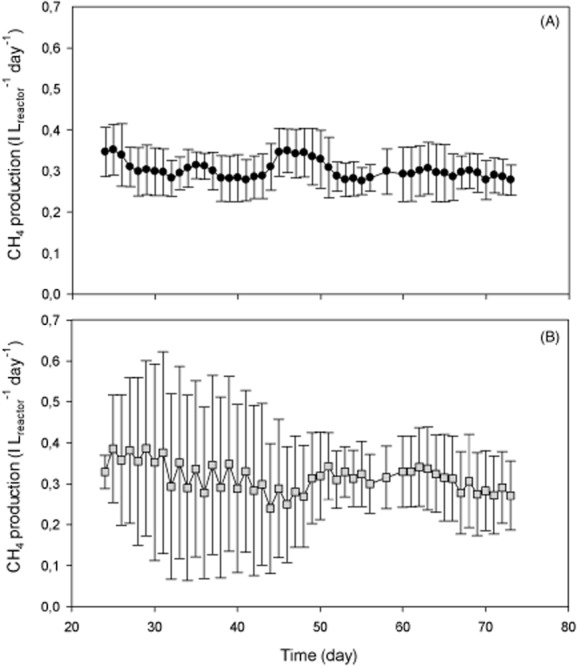
Figure 1.

Performance of the CSTRstable (•) and CSTRdynamic (▪) in terms of methane production. A 7-day moving window, together with the in-window variation of the methane production has been plotted for the CSTRstable (A) and the CSTRdynamic (B), for each day of operation. Each value represents the average and the variation of the value on the day itself and the 6 previous days.
