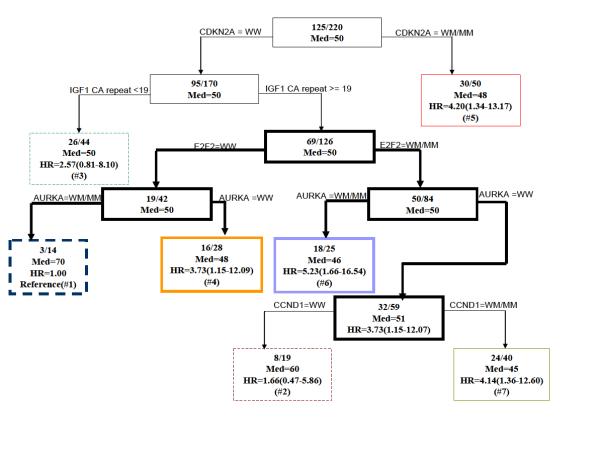
Fig. 1.
Time to onset tree for age of onset of CRC. Inside each node is the number of affected subjects /the total number of subjects. Med = median age of onset. The hazard ratios (HRs) are calculated for all terminal nodes such that terminal node 1 is the reference group. WW = wild type, WM= Heterozygote, MM= Homozygous polymorphism. The terminal nodes are shown in color, the nodes giving rise to gene-gene interaction are shown in bold.

