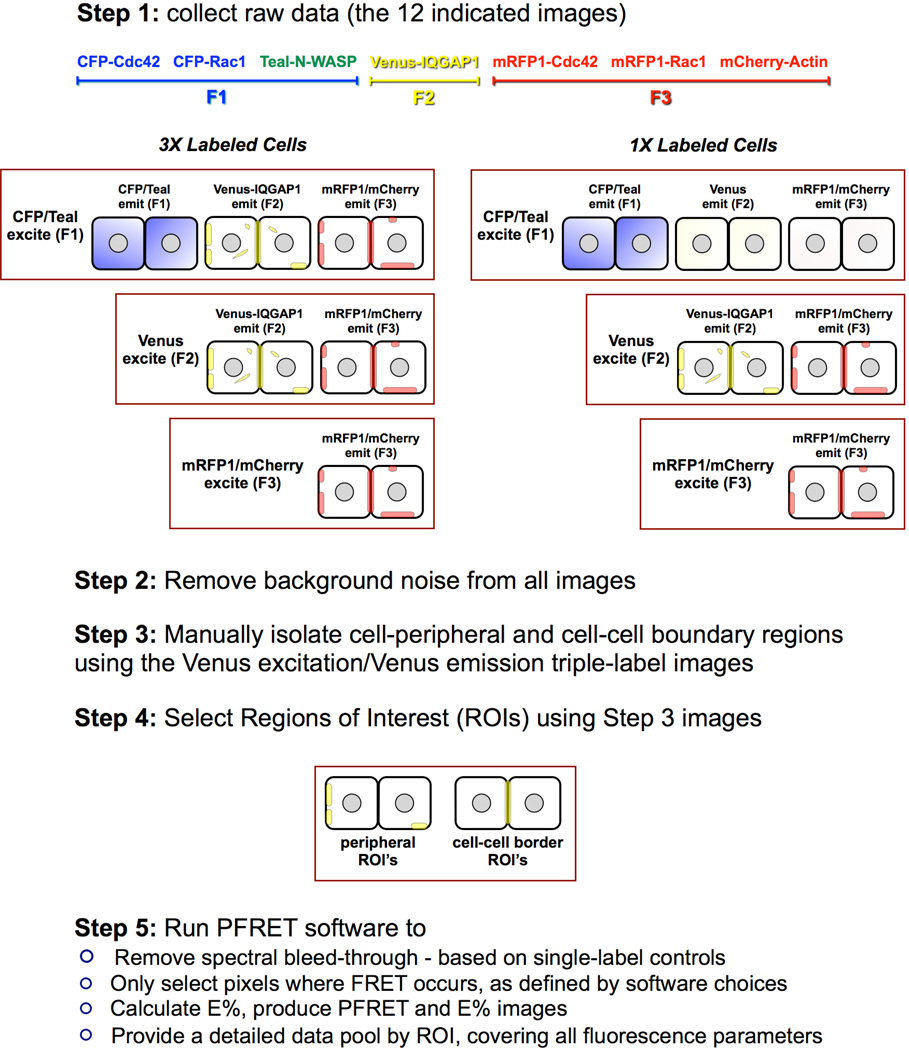
Fig. 3. 3-color FRET image acquisition, processing and analysis procedure.
Step 1. Triple-label and single-label control specimens were imaged using identical conditions. The algorithm requires the acquisition of single-label control images with comparable fluorescence ranges to the triple-label specimens for reliable spectral bleedthrough correction. Step 2. Based on non-transfected cell specimens, imaged at identical conditions, the background noise level was established and deducted from all labeled images. Step 3. Using the Venus-IQGAP1 images (Venus excitation/Venus emission) of the triple-labels as a reference, cell-peripheral and cell-cell boundary regions were manually isolated in ImageJ. Step 4. 3x3 pixel ROI's where 3-color FRET occured were selected within the regions isolated in the prior step. Step 5. The 3-color FRET software processed all selected ROI's to remove spectral bleed-through in each pixel, and calculated a complete set of data by ROI. These data included fluorescence gray levels, corrected FRET (PFRET), intensity ratios, E% and distances between fluorochromes exhibiting PFRET.

