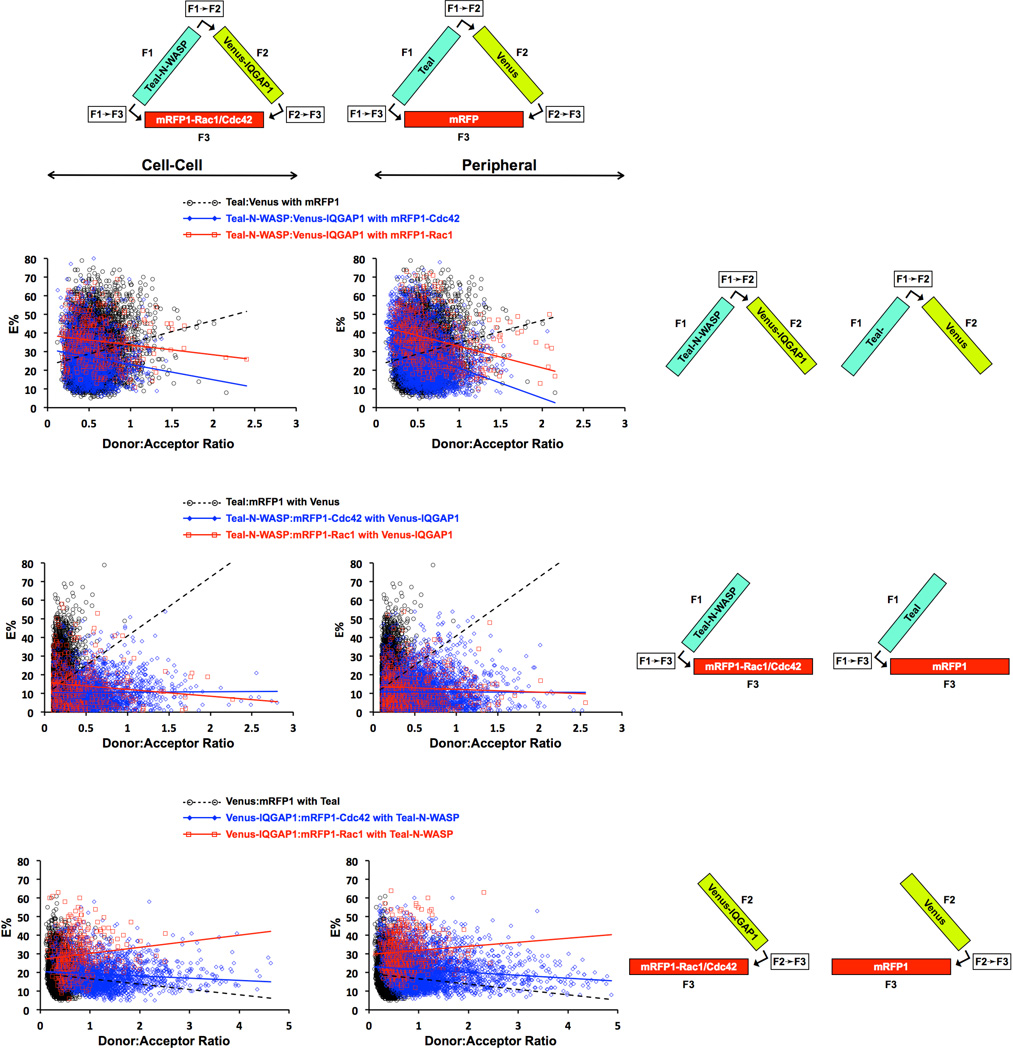
Fig. 6. FRET Efficiencies (E%'s) plotted as a function of donor-to-acceptor (D:A) ratio for cells co-expressing Teal-N-WASP, Venus-IQGAP1, and mRFP-Rac1 or mRFP1-Cdc42, and exhibiting 3-color FRET.
Each data point represents a single ROI at either the cell periphery or cell-cell boundary. Data for cell expressing unfused Teal + Venus + mRFP1 are also shown. Least squares linear regression was used to generate the straight line plot for each data set, and p-values derived from T-tests for each pair of data sets are shown in Table S1, Supplementary Information..

