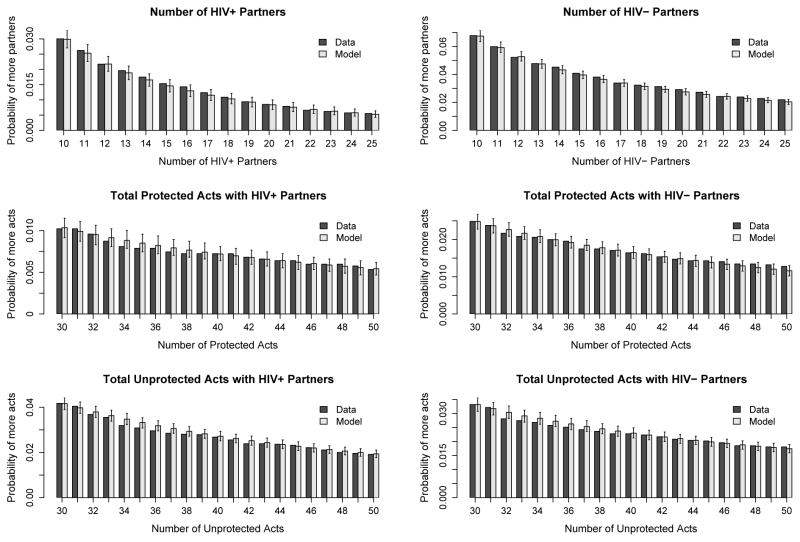
Figure 1.
Comparison of tail probabilities between model posterior predictive distributions and the percentage of HLP data fitting the bin criterion. Each bin reflects the probability of observing values greater than or equal to the outcome value. Outcomes include the number of HIV+ partners, number of HIV− partners, total number of protected acts with all HIV+ partners, total number of protected acts with all HIV− partners, total number of unprotected acts with all HIV+ partners, and total number of unprotected acts with all HIV− partners for all subjects over all time points.

