Figure 2.
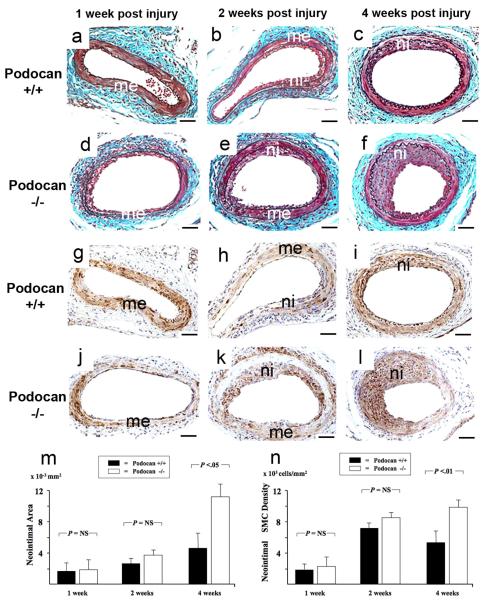
Time course of arterial response to injury with wild type and podocan−/− genotype. Combined Masson Elastin staining: WT genotype (a-c), podocan−/− genotype (d-f): 1 week (a and d): Cells adhere along the arterial surface on the luminal side of the media (me) and an adventitial cellular infiltrate forms in both groups in a similar fashion; x200; scale bar=50 μm. 2 weeks (b and e): A comparably sized typical early neointimal lesion (ni) with densely packed cells has formed in both groups; x200; scale bar=50 μm. 4 weeks (c and f): A moderately sized arterial lesion (ni) has formed with WT genotype; in contrast, with podocan−/− genotype the neointima shows a strongly increased size; x200; scale bar=50 μm. Bar graph (m): Comparison of neointima formation with WT and podocan−/− genotype: neointima area in ×10−2 mm2 (independent sample t-test). Smooth Muscle Alpha-Actin: WT genotype (g-i), podocan−/−genotype (j-l): 1 week (g and j): Alpha-actin expression (brown labeling) is predominantly seen in the media (me) in both groups, no neointima has formed yet; x200. 2 weeks (h and k): Nascent neointimal (ni) alpha-actin expression and a trend towards higher SMC numbers with the podocan−/− genotype can be seen; x200; scale bar=50 μm. 4 weeks (i and l): A steep increase in the numbers of alpha-actin positive cells can be observed in neointima (ni) with podocan−/−genotype; x200; scale bar=50 μm. Bar graph (n): Comparison of neointimal SMC density with WT and podocan−/− genotype: cell density in ×103 mm2 (independent sample t-test).

