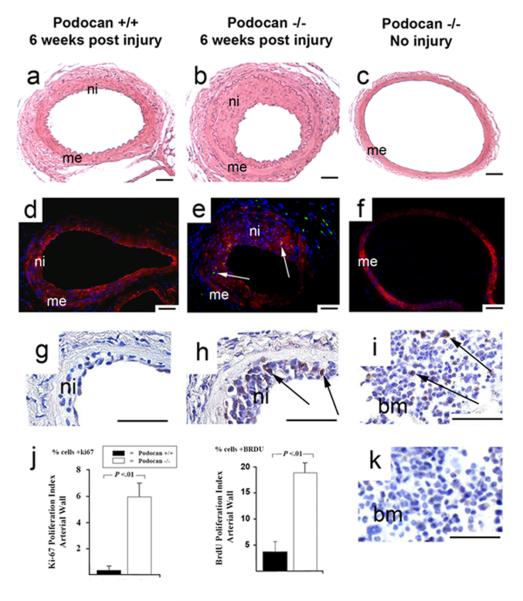
Figure 4.
Late arterial proliferation with wild type and podocan−/− genotype. WT genotype (a, d, g): podocan−/− genotype (b, e, h): H&E staining (a-c): Compared with WT (a) the strong increase in neointima (ni) with podocan−/− genotype (b) persists even at 6 weeks. Non-injured artery (c) of podocan−/− mouse serves as negative control for proliferation labeling; x200; scale bar=50 μm. Ki-67 and smooth muscle alpha-actin double labeling (d-f): At 6 weeks no green (FITC) Ki-67 labeling is seen in neointima (ni) and media (me) with WT genotype (d). With podocan−/− genotype, however, green nuclear Ki-67 labeling (arrows) is seen in neointima (ni) even 6 weeks after injury (e). Non-injured podocan−/− contra-lateral artery does not show any ki-67 signals (f). x200; scale bar=50 μm. BRDU-Labeling (g-i and k): In smaller WT neointima (ni) BRDU-labeling is absent at 6 weeks after injury (g). In contrast, multiple nuclei with brown labeling (arrows) indicating BRDU-incorporation are seen in hypercellular neointima with podocan−/− genotype (h); x200; scale bar=50 μm. Brown BRDU labeling (arrows) is also seen in bone marrow (bm) and serves as positive control (i). Brown labeling is absent with isotype-control staining in bone marrow; x400; scale bar=50 μm (k). Bar graph (j): Comparison of Ki-67 and BRDU expression with WT and podocan−/− genotype 6 weeks after arterial injury: expression in % cells (independent sample t-test).

