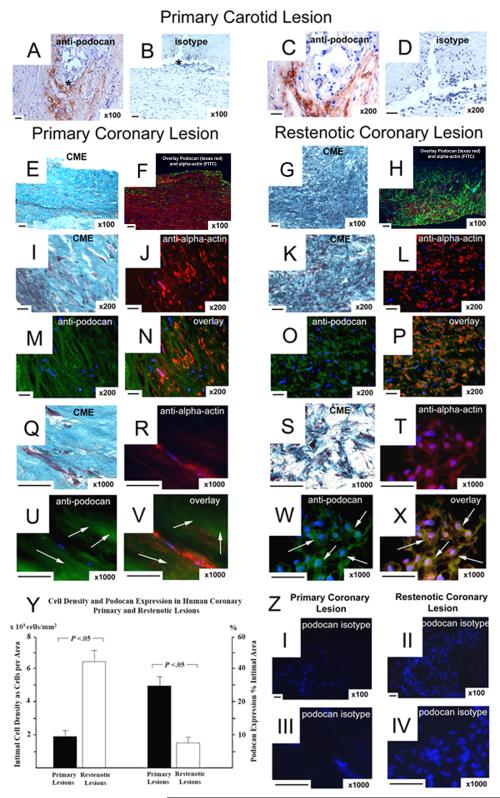
Figure 7.
Expression of Podocan in Human Atheroma: Primary Carotid Atheroma (a to d), Primary Coronary Lesion (e-f and i-j, and m-n, q-r, u-v), Restenotic Coronary Lesion (g-h and kl, and o-p, s-t, w-x): Podocan immunostaining (a–d): An antibody specific for the human form of podocan gives strong brown labeling in the intima of carotid atheroma (a and c); x100; scale bar=50 μm. Matching isotype staining on adjacent section shows no labeling (b and d). Combined Masson Elastin (CME) staining (e–g): Comparing the histo-architecture of primary and restenotic coronary lesions shows distinct differences. Spindle shaped SMC are surrounded by large spaces of ECM at a rather low cell density in primary lesions (e). In restenotic tissue abundant numbers of SMC are tightly clustered and surrounded by a comparatively smaller ECM space (g); x50, x100, x200; scale bar=50 μm. Two Versions of Podocan and Smooth Muscle Cell Double Labeling (f-v): Smooth muscle alpha-actin (FITC) and podocan (Texas-Red) double-labeling (f, h): Low power magnification images reveal the inverse relation between the degree of intimal podocan labeling (red) and the density of intimal smooth muscle cells (green) in primary (f) compared with restenotic (h) coronary plaque tissue. Smooth muscle alpha-actin (Texas-Red) and podocan (FITC) double-labeling (j, m, n and r, u, v): With reversed double labeling higher power magnification images confirm that large ECM spaces in primary lesions surrounding the red-labeled SMC are enriched with podocan as shown by extensive green (arrows) labeling (j, m, n and r, u, v). In contrast, green podocan labeling (arrows) in restenotic tissue covers a much smaller area and is restricted to the immediate vicinity of red-labeled SMC (l, o, p and t, w, x); x200, x1000; scale bar=50 μm. Corresponding intimal locations in adjacent serial sections are also shown by light microscopy and Combined Masson Elastin (CME) staining (i, q and k, s); x200, x1000; scale bar=50 μm. Of note, in both lesion types staining with an isotype control antibody that matches the podocan antibody does not show any green signals (z, I-IV). Bar graph (y): Comparison of podocan expression (% area) and SMC density (cells per mm2) in primary and restenotic coronary lesions: (independent sample t-test).

