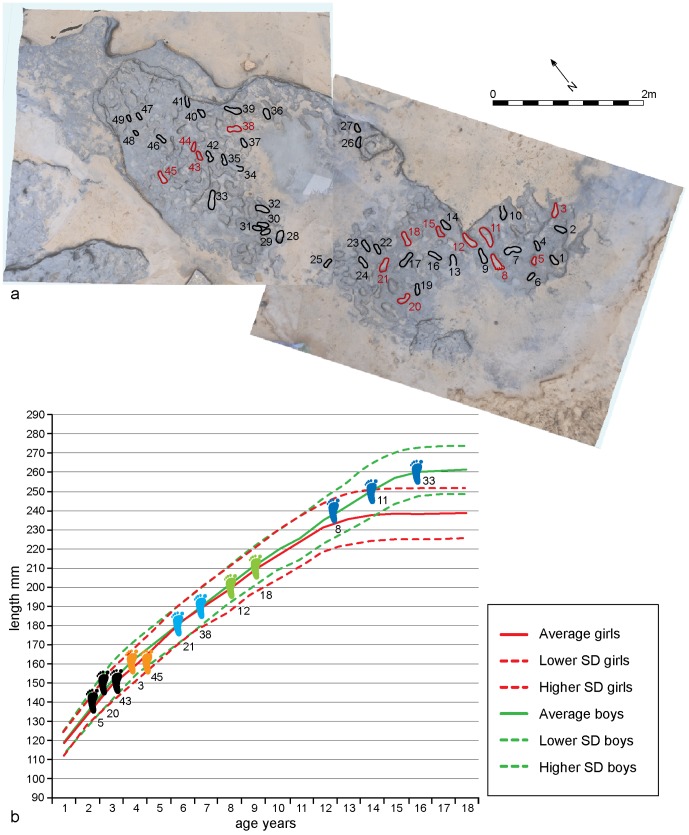
Figure 8. Vertical image of Area A at Happisburgh.
a. Model of footprint surface generated from photogrammetric survey showing the 12 prints used in the metrical analyses of footprint size; b. Plot of length and width measurements of 12 prints showing possible individuals. Means and standard deviations for foot length and age for modern populations are also shown.

