
Figure 10.
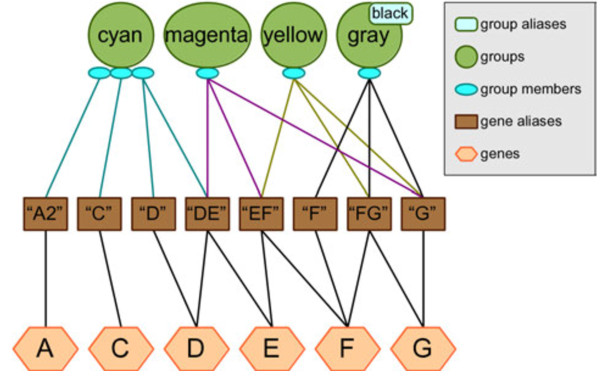
Ambiguity example within the Biofilter simulated knowledge database. The testing knowledge included with Biofilter contains several examples of these kinds of situations, depicted in the diagram. Note that this diagram reflects the fact that there may be multiple names for the same gene (i.e. “D” and “DE” both refer to gene D), and some names may be associated with multiple genes (i.e. “DE” refers to both genes D and E). The “cyan” group contains three genes, of which the third is ambiguous because we are given two identifiers for it, but one of them refers to two different genes. The “magenta”, “yellow” and “gray/black” groups each contain only one gene, but in each case we are given three different names for that. Because of the ambiguity in the provided identifiers, genes considered members of these groups will appear to vary depending on the researcher’s choice for ambiguity settings.