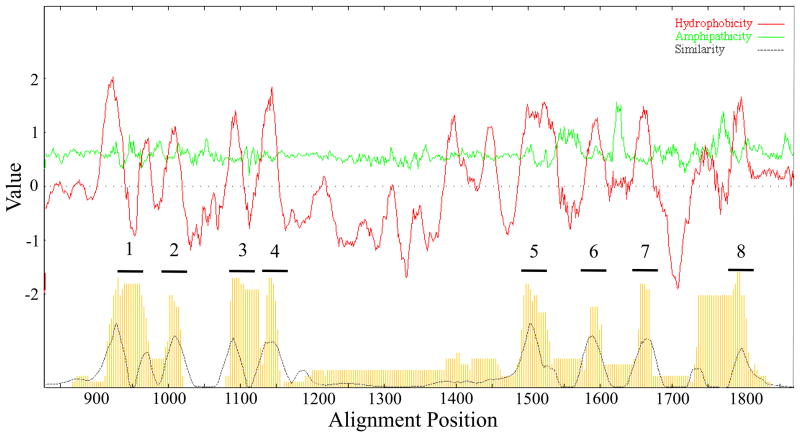
Figure 3.
Portion of average hydropathy, amphipathicity, and similarity (AveHAS) plots for the 189 TSUP family proteins included in this study. A magnification of the TMS-containing region is presented due to the large size of the plot which reveals 8 clear TMSs. However, as many as 12 poorly conserved peaks of hydrophobicity can be seen, suggesting that some homologues have additional TMSs.

