Figure 6.
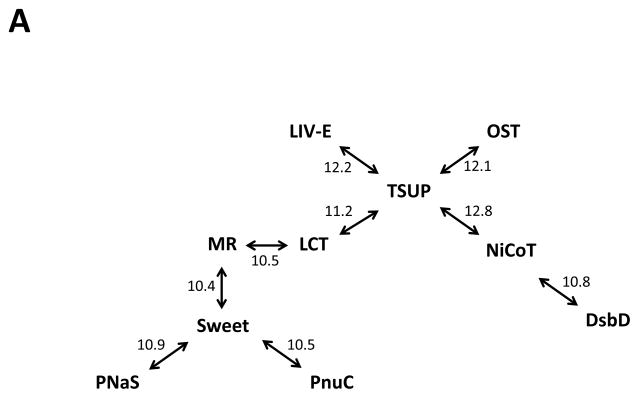
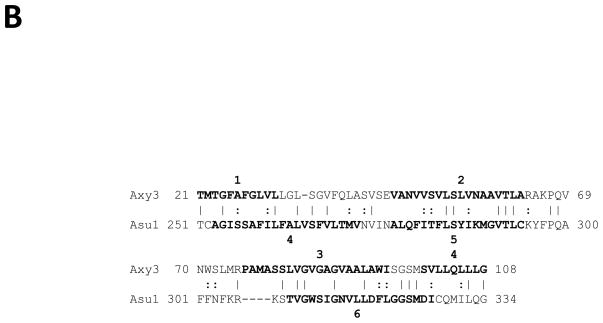
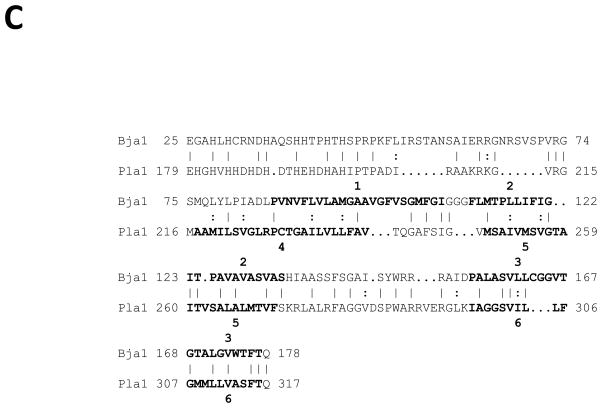
(A) Rhodopsin superfamily homology established through the use of GSAT/GAP and the Superfamily Principle. Established Rhodopsin superfamily proteins from TCDB and their homologues were used to establish homology between all members of the ten families. GSAT/GAP scores, adjacent to the arrows, are expressed in terms of standard deviations (S.D.). (B) Homology between members of the TSUP and LCT families. GAP alignment of TMSs 1–3 of TSUP Axy3 (Achromobacter xylosoxidans; gi 311107599) with TMSs 4–6 of LCT Asu1 (Ascaris suum; gi 324511247). A comparison score of 11.2 S.D. was obtained with 43.8% similarity and 28.1% identity. (C) Homology between members of the TSUP and NiCoT families. GAP alignment of TMSs 1–3 of TSUP Bja1 (Bradyrhizobium japonicum; gi 27376265) with TMSs 4–6 of NiCoT Pla1 (Parvibaculum lavamentivorans; gi 154252649). A comparison score of 12.8 S.D. was obtained with 44.7% similarity and 36.4% identity.


