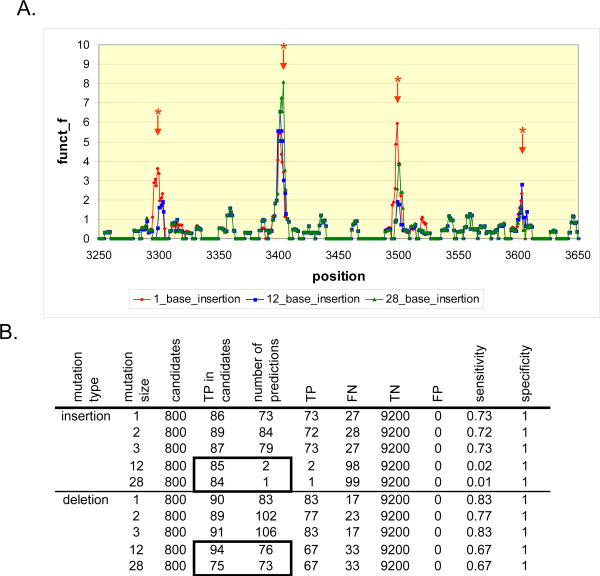
Figure 2. Analysis of results from step one of the indel algorithm. The first step of the algorithm can detect indels of any size.
Insertions of increasing size were introduced in varying percentages from reads derived from a 10.1 Kbp sequence (Supplemental Materials Section 2). Afterwards, the entire sequence data set was aligned with MAQ, and subsequently, IDA was applied for determining the location of these insertions. A. The X axis represents the position along the reference sequence in bp. The Y axis is the detector function f(k). It rises at the position of insertions (*), even when the insertion size is equal to the read length of 28 bp. B. The overall sensitivity of the algorithm drops for insertions greater or equal to 12 bp. This effect is due to the failure of SW to confirm candidate positions correctly identified by the first pass of the algorithm. This can be seen by inspecting the boxed area of the table. An equivalent number of true indels are detected for lengths 1 to 28 bp. However, for insertions, most of these candidates are not confirmed by the step 2 of IDA and very few predictions are made. True positives, false negatives, true negatives and false positives are annotated as TP, FN, TN and FP respectively.

