
Figure 3. Sequencing depth of phiX174 sequence.
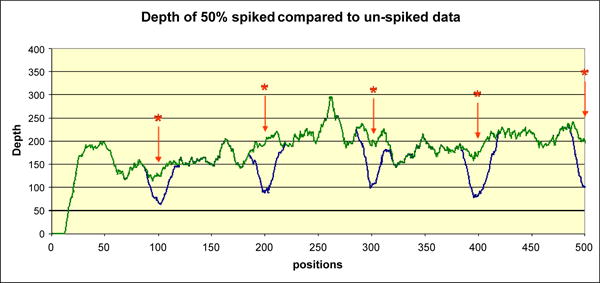
A portion of phiX174 genome is shown covering positions 1-500 as seen on the Y axis. The X axis represents sequencing depth. The blue curve shows data for the 50% spike ratio, while the green curve shows the depth of the data set without any indels. The positions of the spiked indels, occurring in multiples of 100, are marked by a star (*). The sequencing depth at the indel location dips accordingly.