
Figure 4. Normalized depth versus mismatch rate for spiked indels.
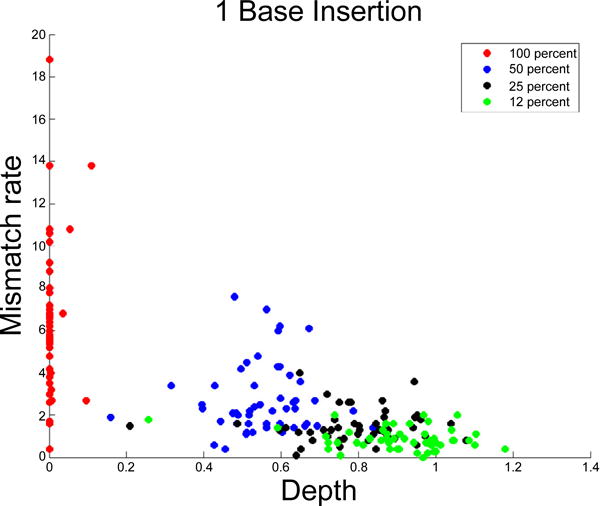
Each data point represents a 1 bp insertion. The X axis represents the normalized mismatch rate [1] m% and the Y axis represents the normalized sequencing depth d%. Results for insertions and deletions 1, 2 and 3 bases in length are similar. Data points are colored accordingly by spike ratio.