


Figure 5. Normalized depth versus mismatch rate for 50% and 100% indels.
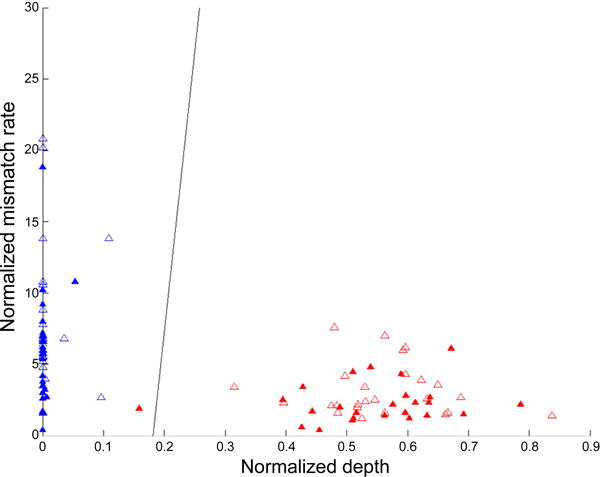
The empty triangles are the training data, the filled triangles are the test data. The X axis represents the normalized mismatch rate [1] m% and the Y axis represents the normalized sequencing depth d%. The red points are the 50% spiked indels, the blue points are the 100% spiked indels. One of the 50% spiked insertions is misclassified. The black line is the linear classification boundary as defined by the following: 197* [1] m% +0.5* d% + 77=0.