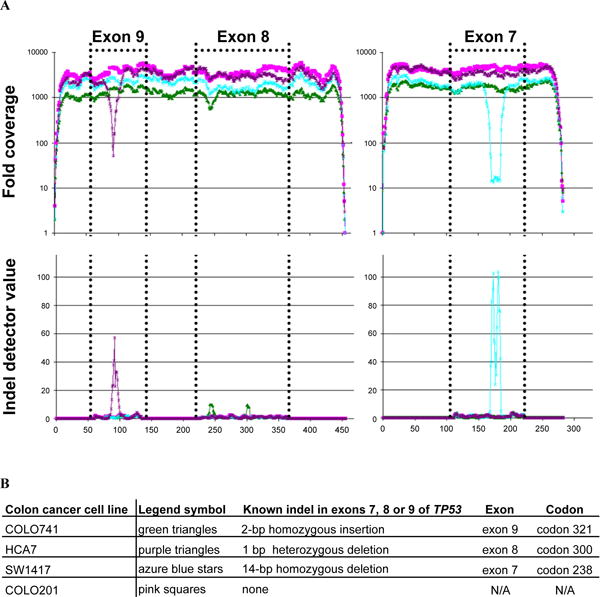
Figure 7. Detection of known indels in four cancer cell lines over exons 7, 8 and 9 of TP53.

Three exons of the TP53 gene were amplified with two separate amplicons and sequenced. The pink solid box/line indicates COLO201, the green solid triangle/line indicates cell line HCA7, azure blue star/line indicates SW1417 and the purple triangle/line indicates COLO741. A. On the Y axis for the top panel is an indication of the overall depth for each bp position of the amplicons. The exon sequence is delineated by dotted lines. Note that the exon order is based on the human genome build 36.3 and runs in reverse order to the genomic sequence. The Y axis on the bottom panel indicates the indel detector function value. The X axis indicates the bp for each coordinate of the two separate amplicons. The positions of the known indels are distinguished by rises in the indel detector function. B. The presence of the three known indels is detected as an insertion or a deletion of the correct sizes and in the correct positions.
