
Figure 6.
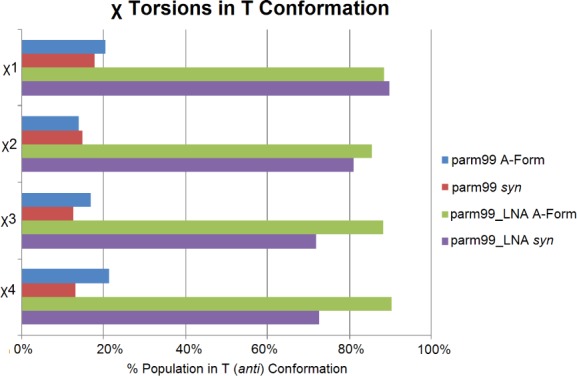
The percentage of each nucleotide predicted to be in the T (anti) configuration is shown for each of the four MD simulations. The parm99_LNA simulations show much closer agreement with NMR, which is consistent with nearly 100% T in solution. Simulations were scored for the entire 3000 ns. A maximum of 1.8% of a G+ (syn) population was observed so most of the non-T population was G- (high-anti). Population details are in Table S12.