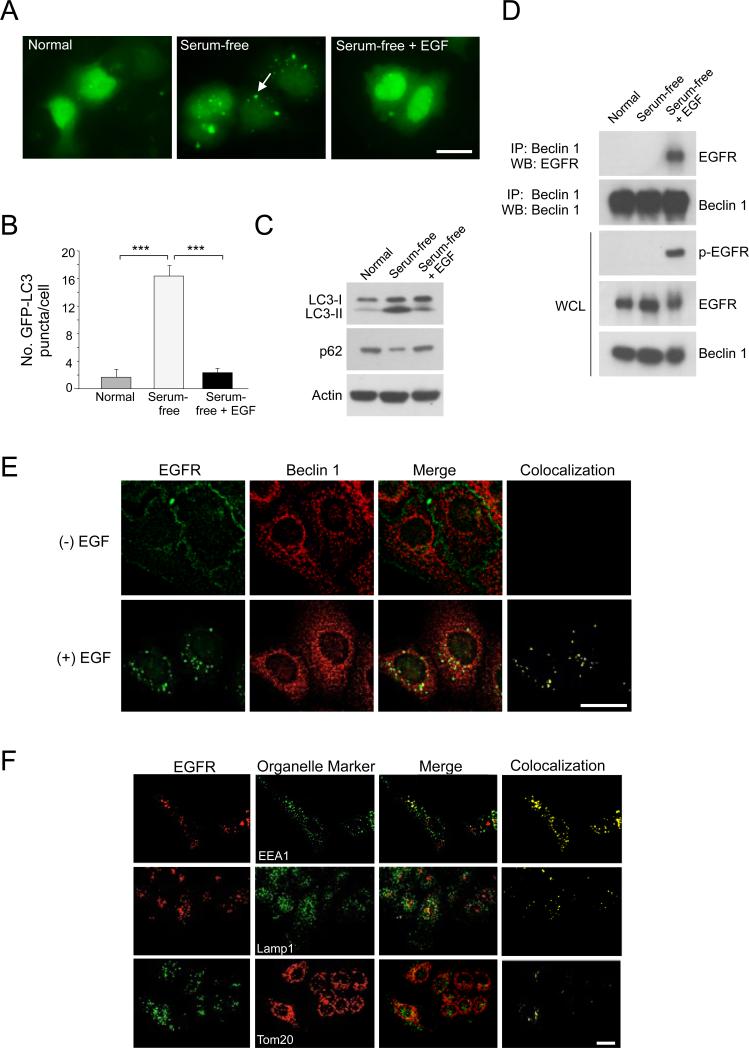
Figure 1. EGFR Activation Inhibits Autophagy and Promotes EGFR/Beclin 1 Complex Formation.
(A) Representative images of GFP-LC3 puncta (autophagosomes) in A549 NSCLC cells cultured O/N in normal medium, serum-free medium, or serum-free medium plus EGF (50 ng/ml, 30 min).
(B) Quantitation of GFP-LC3 puncta in conditions shown in (A). Bars are mean ± SEM of triplicate samples (≥50 cells analyzed per sample). Similar results were observed in 3 independent experiments. ***, P < 0.001, one-way ANOVA.
(C) LC3-I/II and p62 western blot analysis in A549 cells in conditions shown in (A).
(D) Immunoprecipitation of EGFR with Beclin 1 in A549 NSCLC cells in conditions shown in (A).
(E) Colocalization of EGFR and Beclin 1 in EGF-treated A549 cells stably expressing Flag-Beclin 1 (A549/Flag-Beclin 1). Cells were cultured O/N in serum-free medium +/− EGF (50 ng/ml, 30 min), fixed, and immunostained with anti-EGFR (green) and anti-Flag to detect Flag-Beclin 1 (red). Yellow indicates colocalization.
(F) Colocalization of active EGFR with cellular organelles. Cells from (E) were cultured O/N in serum-free medium + EGF (50 ng/ml, 30 min), stained with anti-EGFR and antibodies to detect early endosomes (EEA1), late endosomes/lysosomes (LAMP1) or mitochondria (Tom20). Yellow indicates colocalization.
Scale bars, 20 μm.
See also Figure S1.

