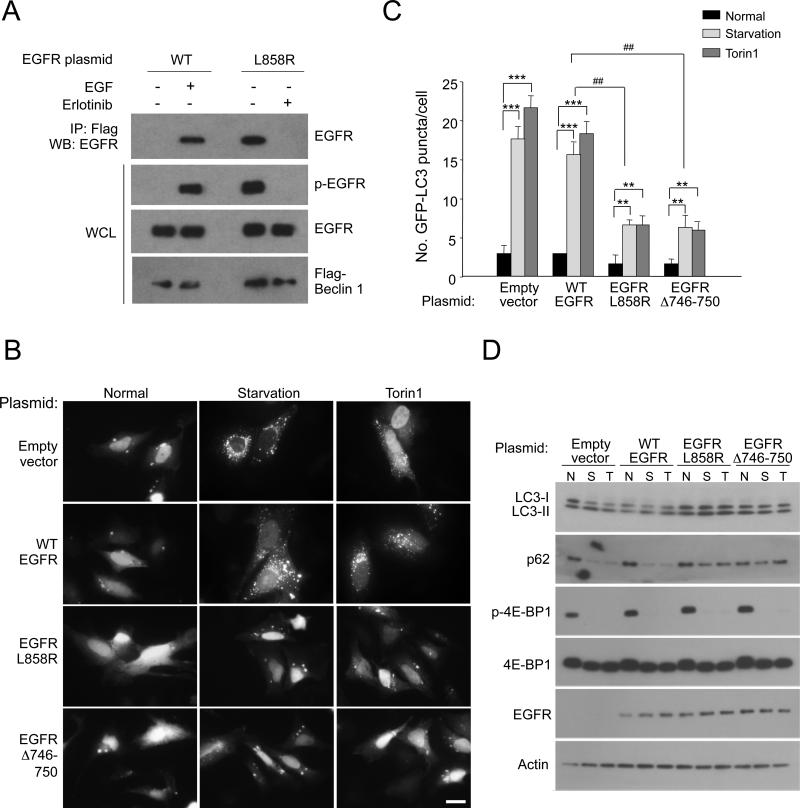
Figure 2. Active EGFR Mutants Interact with Beclin 1 and Inhibit Autophagy Independently of mTOR.
(A) Immunoprecipitation of EGFR with anti-Flag in HeLa cells co-transfected with Flag-Beclin 1 and indicated EGFR plasmid. After O/N serum starvation, they were treated +/− EGF (50 ng/ml, 30 min). Cells transfected with EGFR L858R were either treated with DMSO (Erlotinib −) or (1 μM, 4 h) (Erlotinib +).
(B) Representative images of GFP-LC3 puncta in HeLa cells transfected with indicated plasmid, and grown in normal medium, subjected to amino acid starvation (2 h), or treated with Torin1 (50 ng/ml, 2 h). Scale bar, 20 μm.
(C) Quantification of GFP-LC3 puncta in conditions shown in (B). Bars are mean ± SEM of triplicate samples (≥50 cells analyzed per sample). Similar results were observed in 3 independent experiments. **P < 0.01, ***P < 0.001, one-way ANOVA for indicated comparison; ##P<0.01, two-way ANOVA for comparison of magnitude of changes between different groups.
(D) Western blot detection of p62 and LC3-I/II (to measure autophagy) and p-4E-BP1 (to measure mTOR activity).
See also Figure S2.

