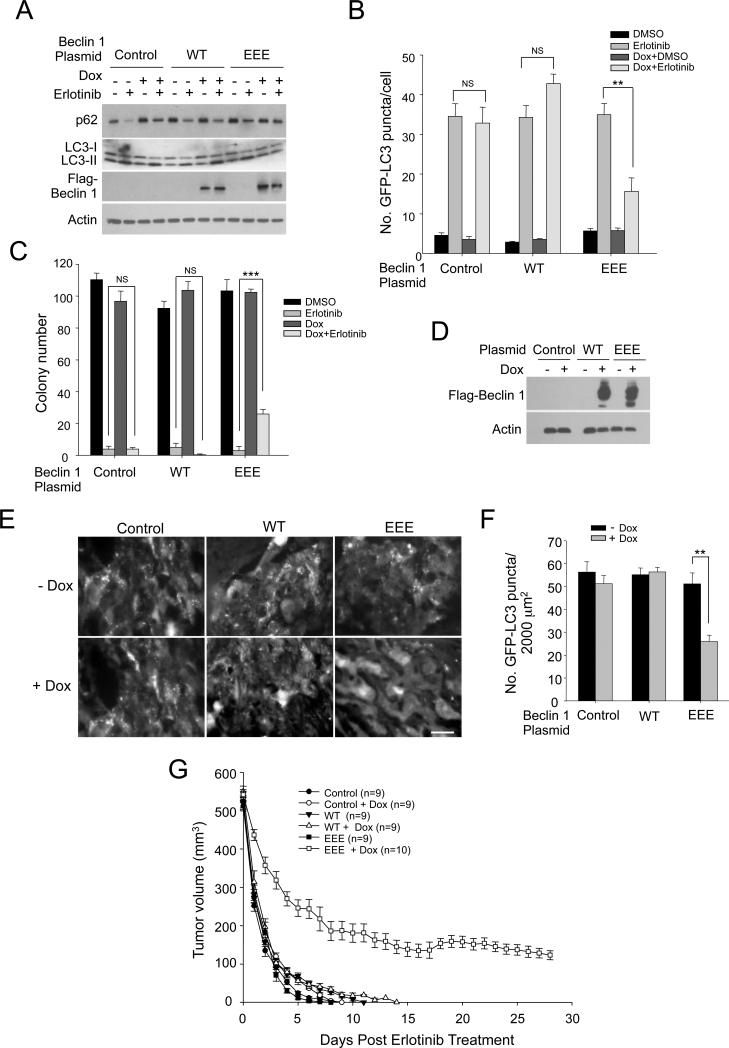
Figure 7. Beclin 1 Tyrosine Phosphorylation Leads to Erlotinib Resistance in NSCLC Xenografts.
(A) Western blot detection of Flag-Beclin 1, p62 and LC3-I/II in indicated HCC827/GFP-LC3 cells with doxycycline-inducible expression of WT Beclin 1 or Beclin 1 Y229E/Y233E/Y352E (EEE). Cells were incubated in +/− doxycycline (1 μg ml−1, 4 days) to induce Flag-Beclin 1 expression and then treated +/− erlotinib (0.2 μM, 2 h).
(B) Quantification of GFP-LC3 puncta for cells treated as in (A). Bars are mean ± SEM of triplicate samples (≥50 cells analyzed per sample). Similar results were observed in 3 independent experiments.
(C) Clonogenic survival of indicated HCC827/GFP-LC3/Beclin 1 cell lines grown +/− erlotinib (0.2 μM, 14 days). Beclin 1 expression was induced by doxycycline (1 μg ml−1, 4 days) prior to erlotinib treatment. Bars are mean ± SEM of triplicate wells per treatment condition. Similar results were observed in 3 independent experiments.
(D) Effect of doxycycline treatment of mice on expression of indicated Flag-Beclin 1 constructs in tumor xenografts. Shown are western blot analyses of tumors 3 days after doxycycline or control treatment.
(E) Representative images of GFP-LC3 staining in indicated NSCLC xenografts treated with 12.5 mg kg−1 erlotinib for 1 day. Scale bar, 20 μm.
(F) Quantitation of number of GFP-LC3 dots per unit area of xenograft. Bars are mean ± SEM for 3 mice per genotype, with 50 randomly selected fields for each tumor.
(G) Effect of erlotinib on tumor response of xenografts formed by indicated HCC827/GFP-LC3/Beclin 1 cell lines. Mice bearing HCC827/GFP-LC3/Beclin 1 xenografts were treated with or without doxycline for 3 days to induce Flag-Beclin 1 expression when the tumor volume reached ~400 mm3, and then treated with 12.5 mg kg−1 erlotinib daily. Values are mean tumor volume ± SEM per time point for 9-10 mice per group. P<0.0001 for EEE vs. EEE+dox; NS for WT vs. WT+dox and FFF vs. FFF+dox; linear-mixed effect model.
For (B), (C), (F), NS, not significant, **P < 0.01, ***P<0.001; one-way ANOVA.
See also Figure S7.

