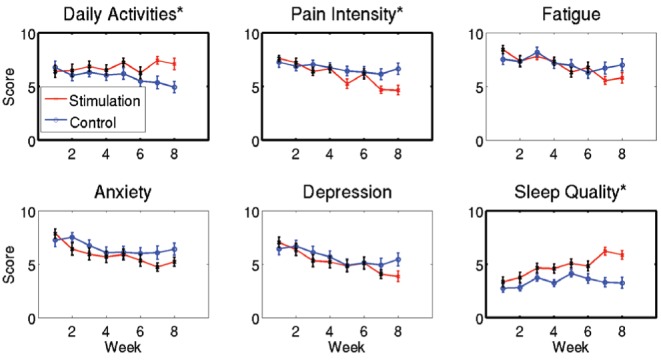
Figure 5).

Equivalent visual scale scores. Curves indicate the mean and error bars indicate the SEM across patients. Variables for which the time × group interaction was significant (P<0.05) for the entire time period are highlighted with an asterisk (*) in the title and are framed with a thicker line (ability to perform daily activities [P=0.03], sleep quality [P=0.04] and perceived pain [P=0.02]). No significant global changes were found for fatigue, anxiety and depression scores. Individual weeks for which the evolution from values before week 1 was significantly different between actual and sham stimulation (time × group interaction P<0.05) have the corresponding bar for the stimulation curve depicted in red; otherwise they are shown in black
