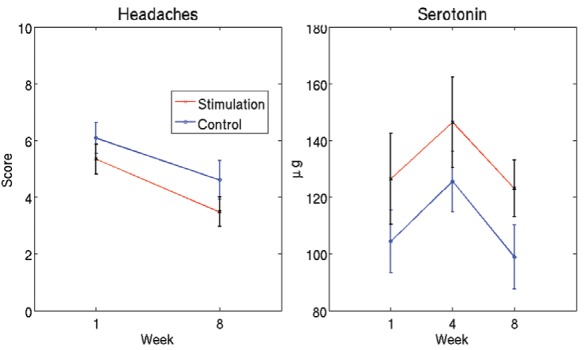
Figure 6).

Severity of headaches and serotonin level. Curves indicate the mean and error bars indicate the SEM across patients. No significant changes (time × group interaction) in severity of headaches at week 8 and serotonin levels at week 4 or 8 were observed
