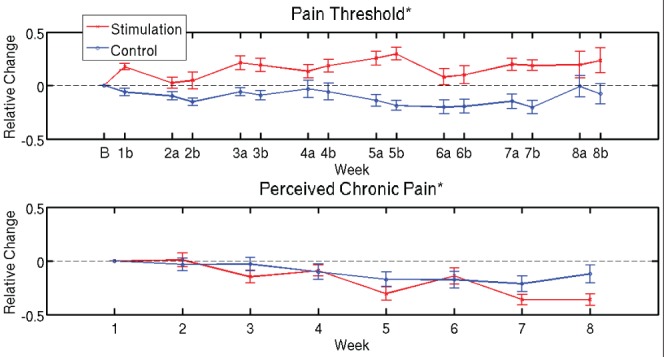
Figure 7).

Relative changes in pain thresholds and subjective chronic pain ratings. Evolution of pain ratings in term of relative changes with respect to week 1. The corresponding absolute values are reported in Figure 4 and 5, respectively. Curves indicate the mean and error bars indicate the SEM across patients. On the time axis, B denotes baseline (before start of treatment) and a and b indicate time instants before and after treatment, respectively, for each week
