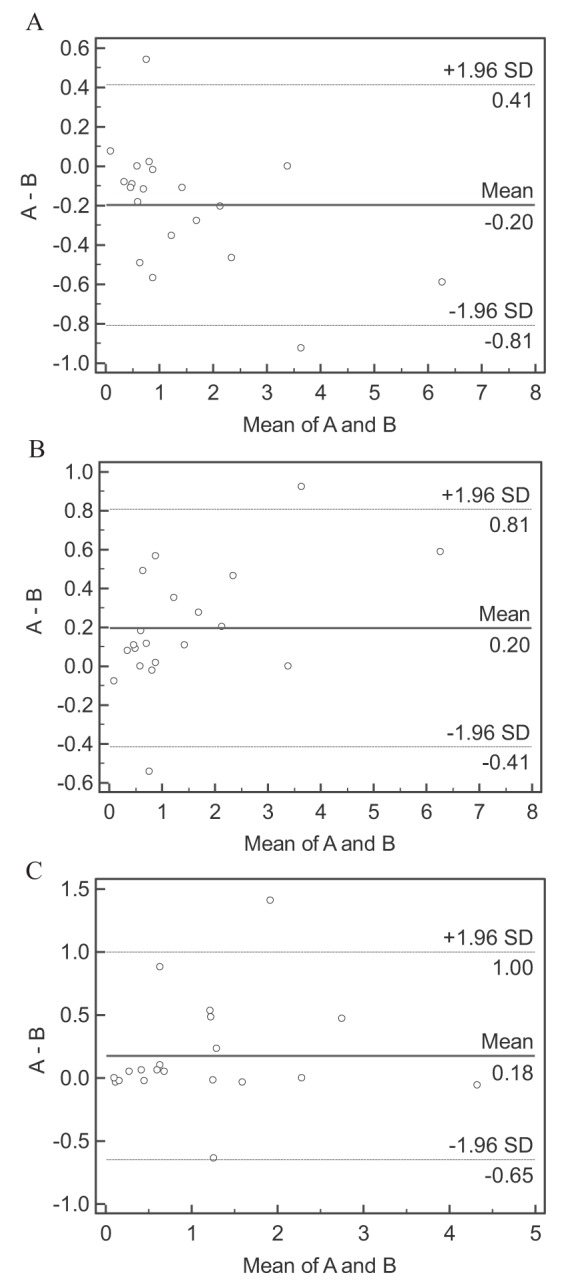
Figure 2).

Bland-Altman plots of the interobserver agreement for differential sputum cell counts. Sputum neutrophil, eosinophil, and macrophage cell counts are represented in plots A, B and C, respectively. The dashed lines represent the interobserver bias (±1.96 SD). A First cytotechnologist cell count; B Second cytotechnologist cell count
