Figure 2.
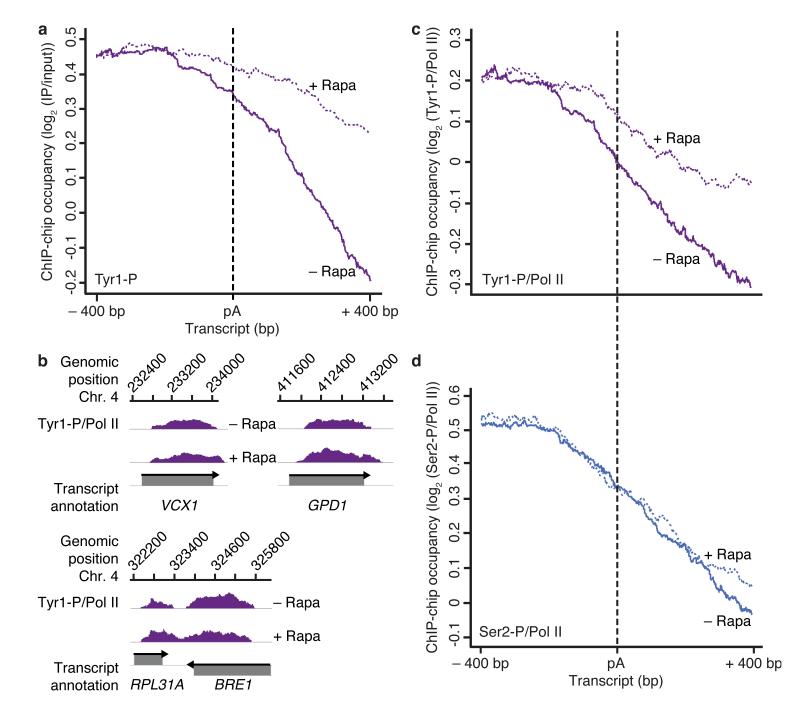
Glc7 is required for Tyr1 but not Ser2 dephosphorylation in vivo. (a) Metagene analysis for genome-wide ChIP occupancy of Tyr1-phosphorylated Pol II around polyA (pA) sites in the Glc7 anchor-away strain, treated with rapamycin to deplete Glc7 from the nucleus (+ Rapa, violet dotted line) or untreated (− Rapa, violet solid line). Averaged ChIP-chip signals are plotted as the median signal (log2 (IP/input)) at each genomic position over a set of 619 representative genes (Online Methods), normalized to have approximately equal occupancy levels upstream (around −400 bp) of the pA site (dashed black line). The profiles are shown from 400 nucleotides upstream to 400 nucleotides downstream of the pA site. Non-normalized data averaged over the entire gene length are shown in Supplementary Fig. 2. Experiments were performed in biological duplicates. (b) Profiles of Tyr1-P levels normalized to total Pol II (Fig. 4a) on selected genes, smoothed by a 150 nt window running median are shown in purple. Below, grey boxes indicate transcripts on the Watson (top) and Crick strands (bottom). (c,d) ChIP-chip occupancy profiles of Tyr1- (c) and Ser2- (d) phosphorylated Pol II over 619 genes aligned at the pA site (dashed line) and normalized against the corresponding Rpb3-profile (Fig. 4a) without and with rapamycin (solid and dotted lines, respectively). Experiments were performed in biological duplicates.

