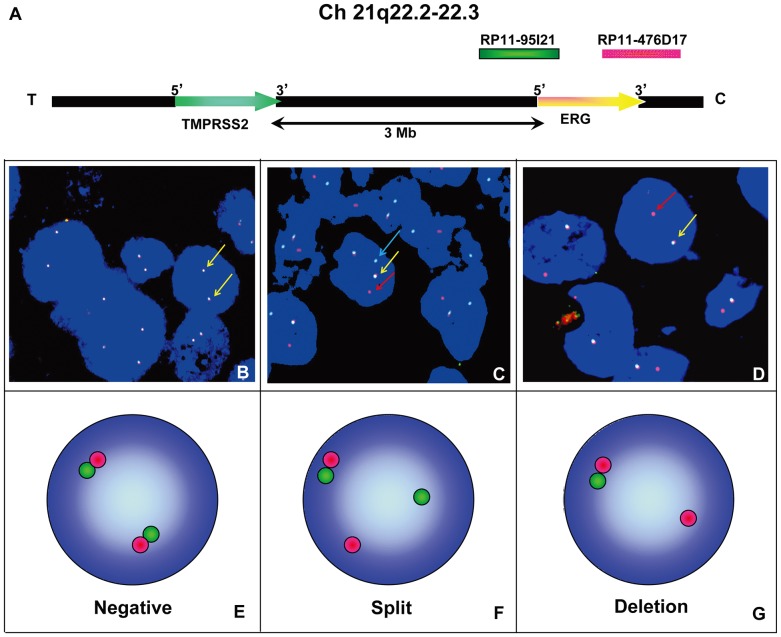
Figure 1. FISH probe design and representative images of ERG rearrangement.
(A) Schematic map of ‘TMPRSS2’ and ‘ERG’ position on 21q22.2–22.3. T and C orientate toward the telomeric and centromeric regions, respectively. BACs located 5′ and 3′ to ERG were used as probes for interphase FISH. Chromosomal coordinates are from the March 2006 build of the human genome using the UCSC Genome Browser. The TMPRSS2and ERG loci are separated by approximately 3 Mb. (B) FISH was performed using BACs as indicated with the corresponding fluorescent label on formalin-fixed paraffin-embedded tissue sections for break-apart FISH of the ERG gene. (B & E), ERG rearrangement negative case, as indicated by two pairs of co-localized green and red signals. (C & F), ERG rearrangement positive (translocation) case showed one pair of split 5′ and 3′ signals. (D & G), ERG rearrangement positive (with deletion) case showed loss of one green labeled probe 5′ to ERG.

