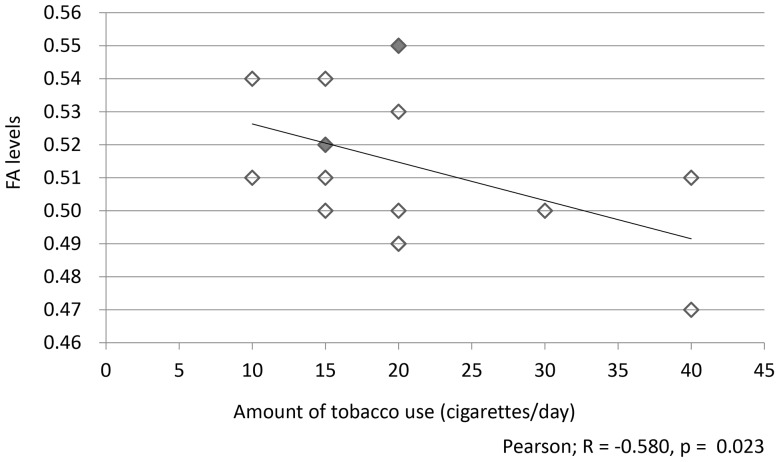
Figure 2. The correlation between FA levels throughout the whole corpus callosum and the amount of tobacco use (N = 16).
There was a significant negative correlation between FA levels throughout the whole corpus callosum and the amount of tobacco use covariant age (cigarettes/day; R = − 0.580, p = 0.023). The number of spots was decreased from 16 to 13 because three spots represented the same data (three represented the FA level = 0.52 and N = 15, and two represented the FA level = 0.55 and N = 20; these spots are shown in gray spots).

