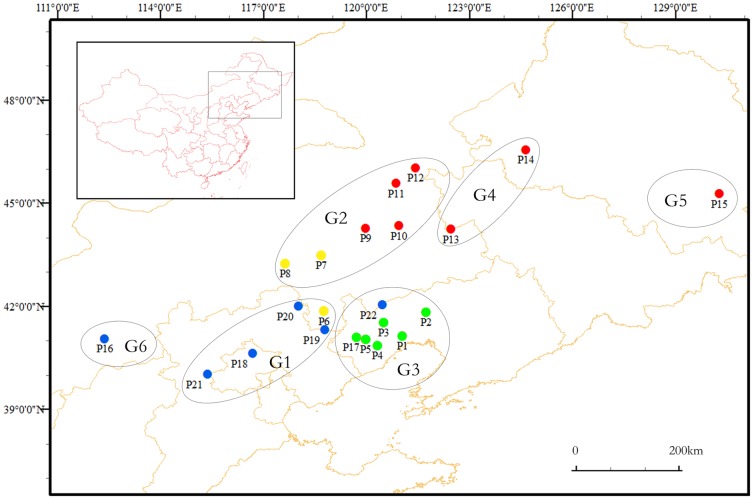
Figure 1. Geographic distribution of the analysed Siberian apricot sampling in China.
The image was generated by the software ArcGIS (ESRI, Redlands, CA, USA). Green dots represent genetic cluster C1, yellow dots represent genetic cluster C2, red dots represent genetic cluster C3, blue dots represent genetic cluster C4.

