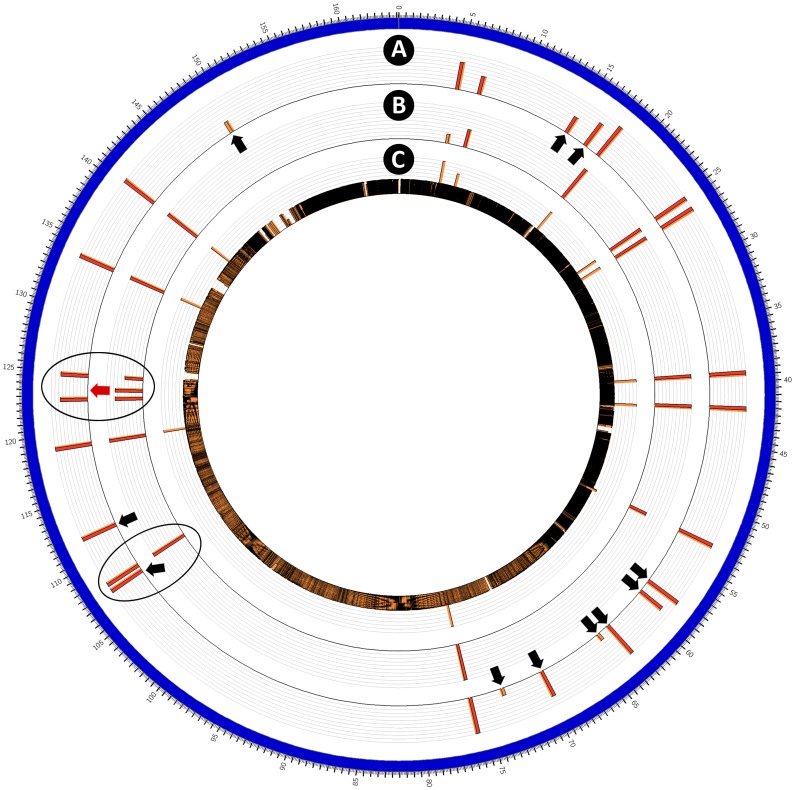
Figure 1. Circular representation of the genome of Campylobacter jejuni NCTC 11168.
Genome maps (in order of presentation from outside to inside) are: (A) K12E5 from an infected human being; (B) NCTC 11168-GSv; and (C) NCTC 11168-V26. The scale on the outside of the outermost map represents genome location (x 104 bases). Red and orange bars represent mutations relative to the original annotated reference NCTC 11168-GS strain deposited in GenBank (AL111168.1) [10], [13]. The height of the red and orange bars indicates mutation frequency. Ovals denote mutations common to NCTC 11168-GSv and K12E5, but not NCTC 11168-V26. Black arrows denote mutations present in K12E5 but not in NCTC 11168-GSv, and red arrows the converse. See Table 1 for additional information.

