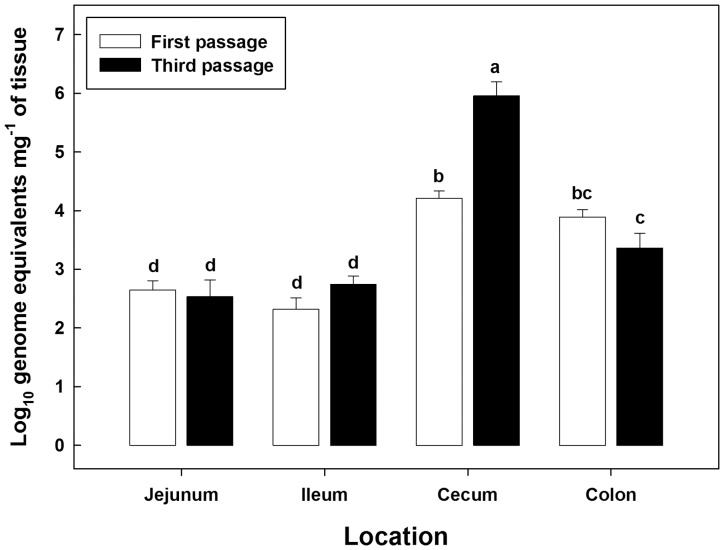
Figure 2. Campylobacter jejuni cell densities (Log10 genome equivalents mg−1 of tissue) associated with mucosa in the jejunum, ileum, cecum, and descending colon of inoculated mice.
White bars indicate C. jejuni cell densities in the first passage, and black bars indicate cell densities in the third passage. Vertical lines associated with histogram bars represent standard errors of the mean, and bars not accompanied with the same letter differ significantly (P≤0.05).

