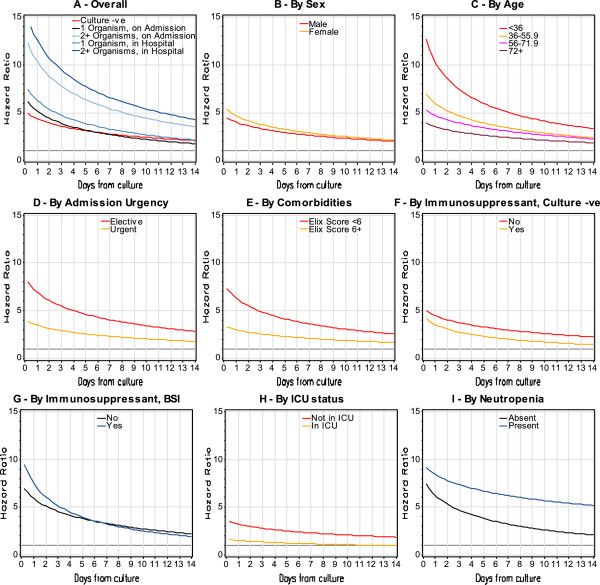
Figure 2.
Stratified and unadjusted influence of negative blood cultures and bloodstream infection on risk of death in hospital. These figures plot the association between day from blood culture (horizontal axis) with relative hazard of all-cause death in hospital (vertical axis) for patients with negative blood culture (red lines) and bloodstream infection (blue lines). These estimates were generated from models in which blood cultures were expressed as time-dependent covariates and are stratified by the characteristic in each title; therefore, the displayed hazard of death is relative to patients in that strata who did not have blood culture testing. Plot A shows the unadjusted association. In the remaining plots (Plot B through I), the stratifying variable for the analysis is presented atop the plot. The p-value for all of the interactions presented here (i.e. plots B to F) is ≤ 0.0001.

