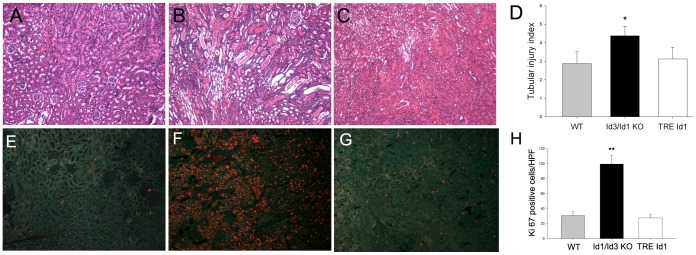
Figure 4. Id1/Id3 knockout mice have increased tubular damage following IRI compared with WT and Id1 transgenic mice.

Hematoxylin and eosin staining of kidney sections from WT (A), Id1/Id3 KO (B) and TRE Id1 (C) mice at day 3 following IRI with corresponding assessment of tubular damage expressed as tubular injury index (1–5) (D) from 5 mice (mean +/− SEM) in each genotype *p<.01. Ki67 staining of from WT (E), Id1/Id3 KO (F) and TRE Id1 (G) mice at day 3 following IRI with corresponding cell counts (H) from 5 mice (Ki67 positive cells/HPF from 10 fields/kidney, mean +/− SEM) in each genotype *p<.001 (unpaired two-tailed t-test). Original magnification = 400X.
